ECG Toolkit
Calipers, laddergrams and QTc, free and in your browser · version
Start here
Three tools share one tracing. ECG Markup puts calipers and annotations on an ECG. Ladder Studio draws laddergrams over it. The QTc Calculator measures the QT and corrects it. Open a tracing in any tab and the others pick it up, along with its calibration.
It's built for people who already read ECGs and want to measure precisely, mark up tracings for teaching, or explain conduction. It doesn't try to reteach interpretation.
- Open ECG Markup and drop in a tracing: drag a file, paste a screenshot, or choose a photo.
- Check that the blue calipers span five large boxes, then tap Looks right.
- Tap + Caliper, drag its legs onto an interval and read the result. Then try Ladder Studio: the same tracing is waiting there.
Everything runs on your own device. Tracings you open are never uploaded.
Getting a tracing in
Use Open tracing, drag a file onto the page, or paste a screenshot. ECG Markup also opens PDFs. Phone photos of paper, EHR screenshots, monitor strips and device electrograms all work.
Tracing prep
When a tracing opens, the toolkit checks the paper grid. A square tracing goes straight in. A slight tilt is straightened automatically, with an Undo in case you'd rather not. A photo taken at an angle gets a Square it up card, which corrects the perspective so calipers line up across the whole strip. Tracings without a grid, such as electrograms, are left alone. In ECG Markup, Edit image has manual straightening, perspective, cropping and lighting.
Calibration
Every measurement depends on it. The toolkit reads the grid and proposes a scale: the blue calipers should span five large boxes, which is one second at 25 mm/s. If they do, accept it. If not, put one leg on a heavy grid line and the other five large boxes later. For a tracing without paper, calibrate to a known interval instead, such as timing marks or a paced cycle length. A calibration set in one tab is used by the others for the same tracing.
ECG Markup
A typical session
- Open a tracing and let tracing prep level it.
- Check calibration. If the calipers span five large boxes, tap Looks right.
- Measure. Add calipers as you need them. Each gets its own color, and you can label it RR, PR, QRS or QT. A QT caliper with an RR caliper shows the QTc on the tracing.
- March repeats a caliper's interval across the tracing, to check regularity or look for hidden P waves. In flutter, march the flutter waves to see whether one falls halfway between the ones you can see.
- Annotate. Arrows point to small or hidden P waves, boxes group parts of a rhythm, numbered markers name beats, and text adds a short caption. + Amplitude measures height, such as ST deviation or QRS voltage.
- Redact names, IDs and dates before sharing anything.
- Export image, then Copy image to paste into a message or slide, or Save PNG.
The eraser button clears every caliper and mark at once, with Undo.
The most common caliper mistake is measuring in only one lead. Part of a waveform can be isoelectric in one lead and obvious in another, so a single lead can hide where a QRS starts or a T wave ends. Before you set a caliper leg, look up and down the entire tracing at that moment in time. Also measure several beats. A finding that repeats is more believable than a one-off.
Measure the sinus cycle length from P waves you can see, then move that interval forward and backward to look for P waves hiding in a QRS, a T wave, or behind a PVC. March spaces the intervals with mathematical precision, but the sinus rate varies a little from beat to beat. So it's often better to slide a single caliper and look in the general area, allowing a few milliseconds either way.
The QTc
The QTc Calculator measures the clearest lead automatically when a tracing opens and shows each step: calibration, RR, QRS and QT. Tap Review on any step to check or adjust its calipers, or measure by hand.
What a clinician really needs to know
We measure the QT for one reason: it marks susceptibility to torsades de pointes. The ideal way to choose a correction formula would be to compare how well each predicts torsades or sudden cardiac death. That large comparison doesn't exist. Most formulas come from mathematical fitting, and the usual test, whether the corrected value is independent of heart rate, isn't obviously the right one. Bradycardia itself raises torsades risk, so some rate dependence may be appropriate.
The best evidence I've found is a study of nearly 50,000 patients that compared five formulas by how well they removed heart rate and predicted 1-year mortality (Vandenberk et al., PACE 2018). Fridericia did best with a narrow QRS. Rautaharju, which corrects for QRS duration, did best with a wide QRS or ventricular pacing. Bazett, the formula most ECG machines report, overcorrects at fast rates, undercorrects at slow ones, and labels most wide-QRS patients prolonged. Not every study agrees: a smaller cohort from Iran found Bazett predicted cardiac mortality best, while a larger one from China found Bazett performed worst.
So this toolkit defaults to Fridericia for a narrow QRS and Rautaharju for a wide one, and shows Bazett because that's the number in the chart. Dodd/Smith is offered for a wide QRS too, as used in Dr. Smith's ECG Blog's own calculator. All-cause mortality isn't torsades, though. Critical illness can lengthen the QT for reasons unrelated to arrhythmia. Every QTc formula is an imperfect estimate of an imperfect marker. Use it alongside the clinical picture, not instead of it.
Measuring the QT
I usually measure in leads II and V5, which have the best evidence behind them from long QT syndrome. If another lead shows the end of the T wave much more clearly, use it. I find the end of the T wave by eye.
U waves are the hard part, and nobody really knows what to do with them. Many references say to exclude them. My reasoning runs the other way. Torsades is a disorder of repolarization, and a U wave is repolarization too. I mostly measure the QT closely when I'm dosing antiarrhythmic drugs, and there I'd rather overestimate and lower a dose than underestimate and miss torsades. So I include any possible U wave. This is a deliberate, conservative choice, not a standard.
For the RR interval, I use the cycle ending in the beat I measured the QT on. The QTc works best in regular sinus rhythm without ectopy. With premature beats, the "right" RR is unclear. In atrial fibrillation, average several beats, and treat the result as a rough estimate.
500 ms is the number I teach. It doesn't forbid a QT-prolonging drug, but at 500 you should be paying attention. In practice, dosing antiarrhythmics is a judgment call that weighs the number against the patient. A patient with a defibrillator is protected in a way one without isn't, and a faster rate is somewhat protective, so I'm more lenient when the patient is tachycardic.
Further reading: Guangzhou Biobank cohort, 2024 · Fasa PERSIAN cohort, 2022 · How to measure the QT interval (ESC)
Laddergrams
A laddergram draws conduction over time: one tier per level (usually atrium, AV node and ventricle), vertical impulses where each wave fires, and sloped lines for conduction between them. If you're new to reading them, Ken Grauer's How to Draw a Laddergram is a good start.
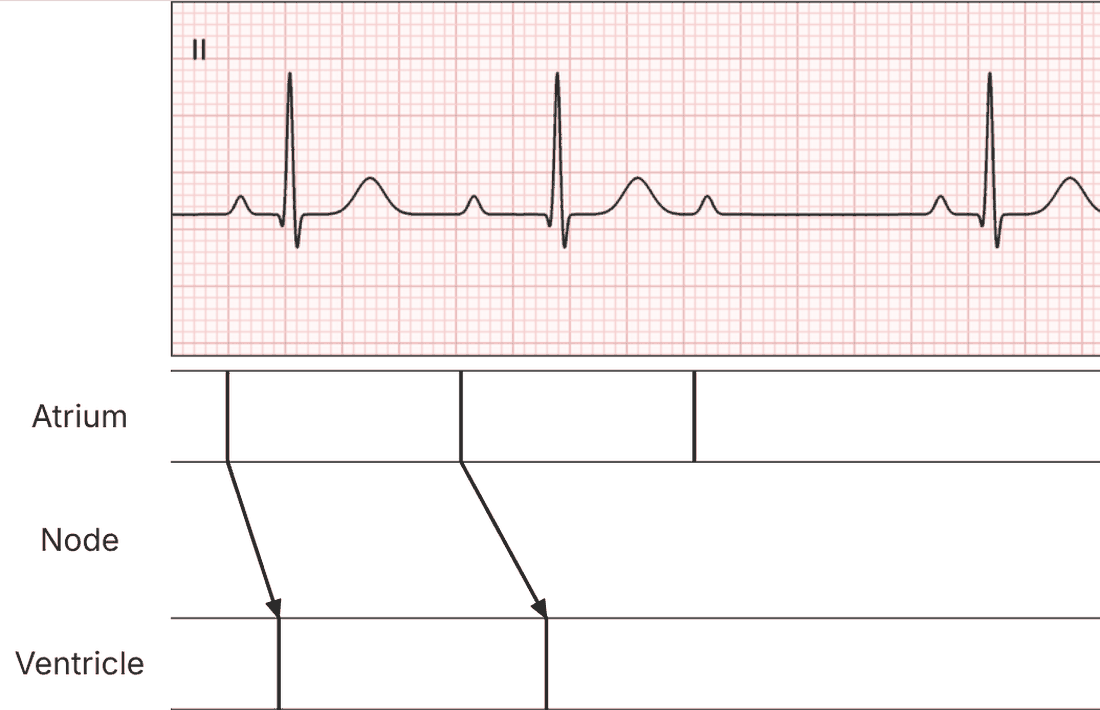
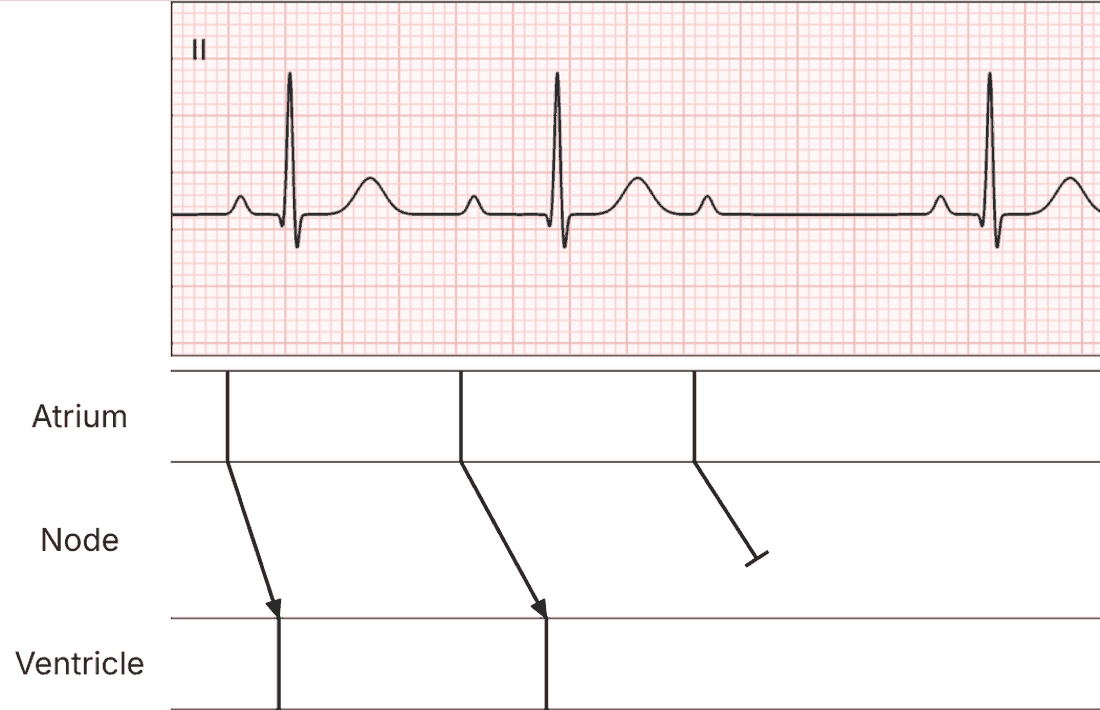
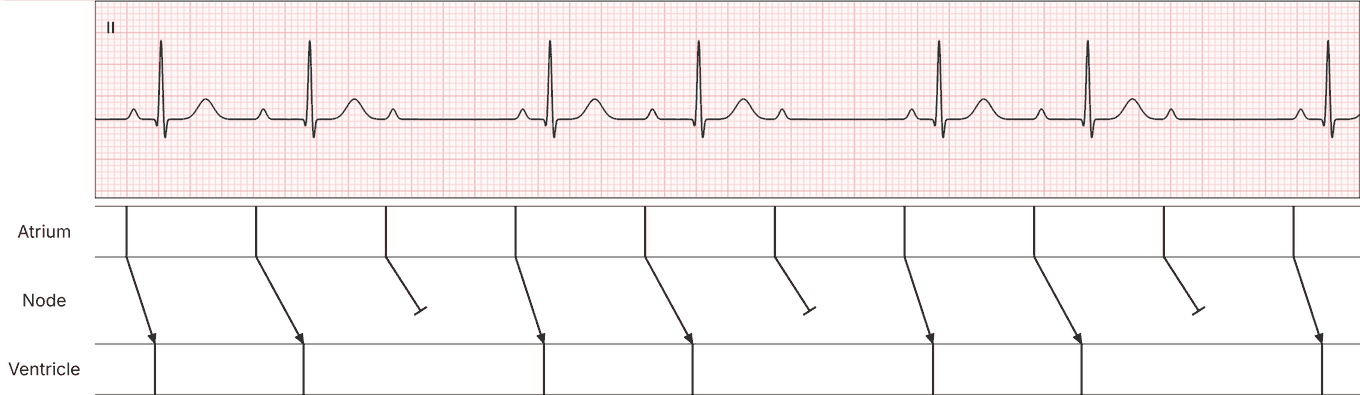
Worked example: 3:2 Wenckebach
- Place the P waves. Hover over each P wave of the cycle and press 1 to drop an impulse in the atrial tier. Click an impulse and use the arrow keys to line it up exactly with its P wave.
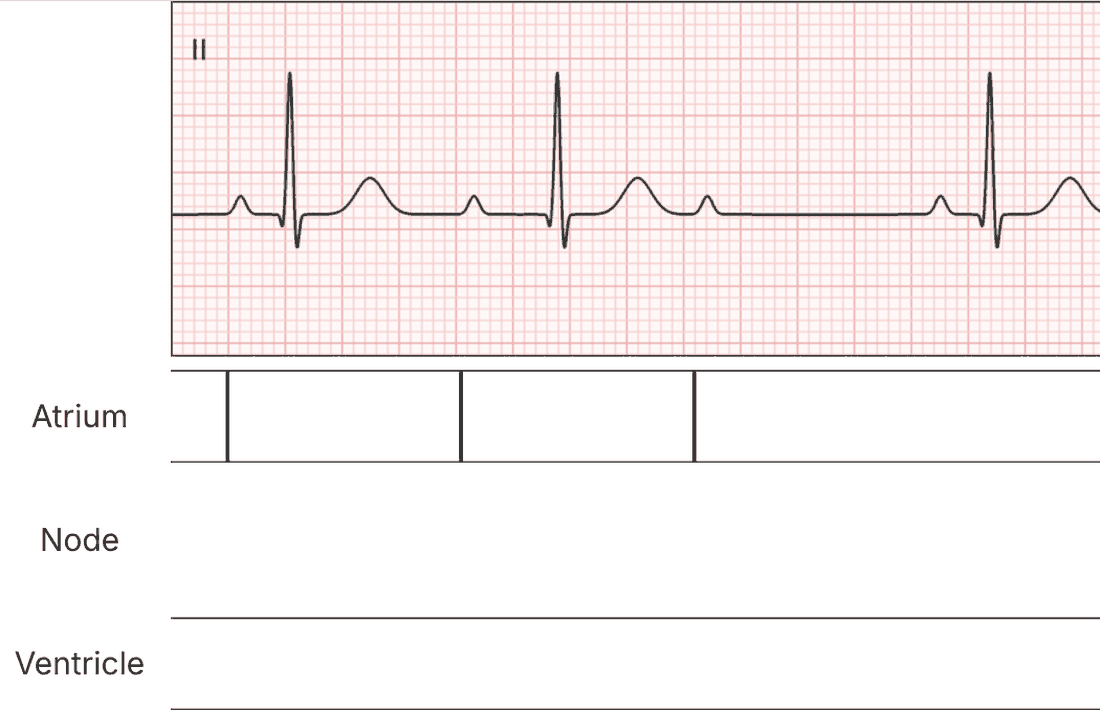
- Place the QRS complexes. Hover over each one and press 3, or use Diagram → Detect QRS complexes and delete any you don't need.
- Draw conduction. Press C, click the bottom of the first atrial impulse, then click the top of its ventricular impulse. The line finishes on its own. Repeat for the second beat.
- Draw the blocked beat. Press C, click the bottom of the last atrial impulse, hover in the middle of the node tier, and press B to end the line with a block bar.
- Press Esc to return to Select.
- Repeat the cycle. Drag a box around the whole cycle, press ⌘C, hover where the next cycle begins, and press ⌘V. Sinus rate varies a little, so nudge each pasted P wave onto its P wave with the arrow keys. Repeat for each cycle.
Reentrant atrial rhythms like flutter fire at an almost perfectly fixed cycle length, unlike sinus P waves. Drop two or three flutter waves with 1, select them and press R to repeat them across the strip. Then pin the first and last impulses to flutter waves you can see clearly, select them all, and press D to space them evenly. Flutter waves buried in QRS complexes and T waves land where they must be.
The usual multilevel block is 2:1 in the upper AV node and Wenckebach below it. The first time I saw a different arrangement, I tried to force it into that pattern and couldn't. The overall ratio was 5 P waves to 2 QRS complexes. If the upper level were 2:1, five P waves would have to become two and a half, which can't happen. It only works as 5:4 Wenckebach on top and 2:1 below: five become four, and four become two. I didn't really understand the tracing until I tried to draw it.
More tools
Ectopic (E) starts conduction from a dot inside a tier, for PVCs, PACs and junctional beats. Multilevel block (M) guides you through block at two levels. Stamps place ready-made PVC, AVNRT, AVRT, fusion and exit-block patterns. Dashed lines suit concealed or uncertain conduction. Select lines to set a pathway (fast red, slow blue, accessory pathway purple) or change their ends, width and color.
Keeping your work
Diagrams save automatically to Library in the side panel, in this browser. Save as copy keeps the current version and carries on in a copy, so you can try another interpretation. Download ladder file saves the whole editable diagram, ECG included, to open on another device or send to a colleague. PNG and SVG are pictures only.
Shortcuts and troubleshooting
Ladder Studio
- 1–9
- Drop an impulse in that tier at the cursor (1 on a P wave, 3 on a QRS)
- I C E M T
- Impulse, Conduct, Ectopic, Multilevel block, Text
- B / A
- While drawing: end with a block bar / an arrowhead
- S or Esc
- Select
- D
- Distribute selected impulses evenly
- R
- Repeat the selection across the strip
- J
- Connect each QRS to the P wave before it (1:1)
- ⌘C ⌘V
- Copy, then paste at the cursor
- ← →
- Nudge the selection (hold ⇧ for bigger steps)
- Alt
- Hold to turn off snapping
- Z + drag
- Zoom to a beat; 0 fits the window
ECG Markup
- ← →
- Nudge the last caliper leg you touched (hold ⇧ for finer steps)
- M
- March the selected caliper on or off
- Delete
- Remove the selected caliper or mark
- ⌘Z
- Undo
- ⌘ + scroll
- Zoom
On Windows, use Ctrl in place of ⌘. On a phone, the Fine-tune pad nudges calipers precisely.
If something looks wrong
- Measurements seem off. Check the calibration first: the blue calipers should span five large boxes. Recalibrate if not.
- No grid found. Calibrate by hand, using a known interval if there's no paper.
- Detect QRS misses or adds beats. Delete the extras and drop any misses with 3. If it warns that the time scale looks off, fix it under Diagram → Time scale.
- A ladder diagram is missing. The Library lives in one browser on one device. Use Download ladder file to move diagrams between devices.
About
I'm Willy Frick, an electrophysiology fellow in my final year of training. I'm passionate about ECGs and clinical education. I love building learning tools, teaching at the bedside and online, and talking ECGs with people all over the world. I fell in love with ECG interpretation during cardiology fellowship, and Dr. Smith's ECG Blog was my introduction to ischemia. It's still the foundation of how I read ischemic ECGs today.
These tools started with frustration. I used to draw laddergrams by hand in Keynote. A rough one took 15 to 20 minutes, and one I was proud to share could take over an hour. Small changes would break them, and they still never looked quite right. Other ladder tools existed, but I didn't find them user-friendly or flexible enough. So I built a QT measurement tool, and when that worked well, I built calipers. When those worked well, I built the laddergram tool.
Doing electrophysiology without calipers is like managing diabetes without a blood glucose. Calipers make rigorous ECG analysis possible, and laddergrams make conduction explainable. Drawing a laddergram is also a test of understanding: it shows you which parts of a tracing you can't yet explain, and it often reveals the small deflection that turns out to be the key.
Using what you make
Use your exported images however you like, in talks, posts, teaching, or conversations with colleagues. No credit needed. If you find the toolkit useful, please share the link so others can use it too.
Thanks
To Ken Grauer for his thoughtful feedback, and to my fellow editors at Dr. Smith's ECG Blog.